Boosted Forest, Gen 2
After working with a spatial Bayesian model that is more complex and computationally intensive, I wanted a lighter, more standard model to see how much of the signal can be captured with straightforward features. The goal is practical: get robust point estimates quickly, examine where the model succeeds and where it fails, and use those insights to guide feature work and targeted data cleaning.
Approach
The model uses a compact set of features, standardized area and floor, elevator presence, outdoor space and parking indicators, simple transport-distance signals, and listing date, plus raw coordinates so the trees can pick up location patterns without heavy spatial machinery. I favor straightforward features that are easy to interpret and iterate on.
Normalization: numeric inputs are standardized (subtract the training mean and divide by the training standard deviation) so that area and floor enter the model as comparable, scale-free features. Distances were rescaled to meters and then standardized; time is represented as days since the earliest observation and standardized as well. Categorical variables are encoded as small integer codes so tree-based splits remain interpretable.
Outputs
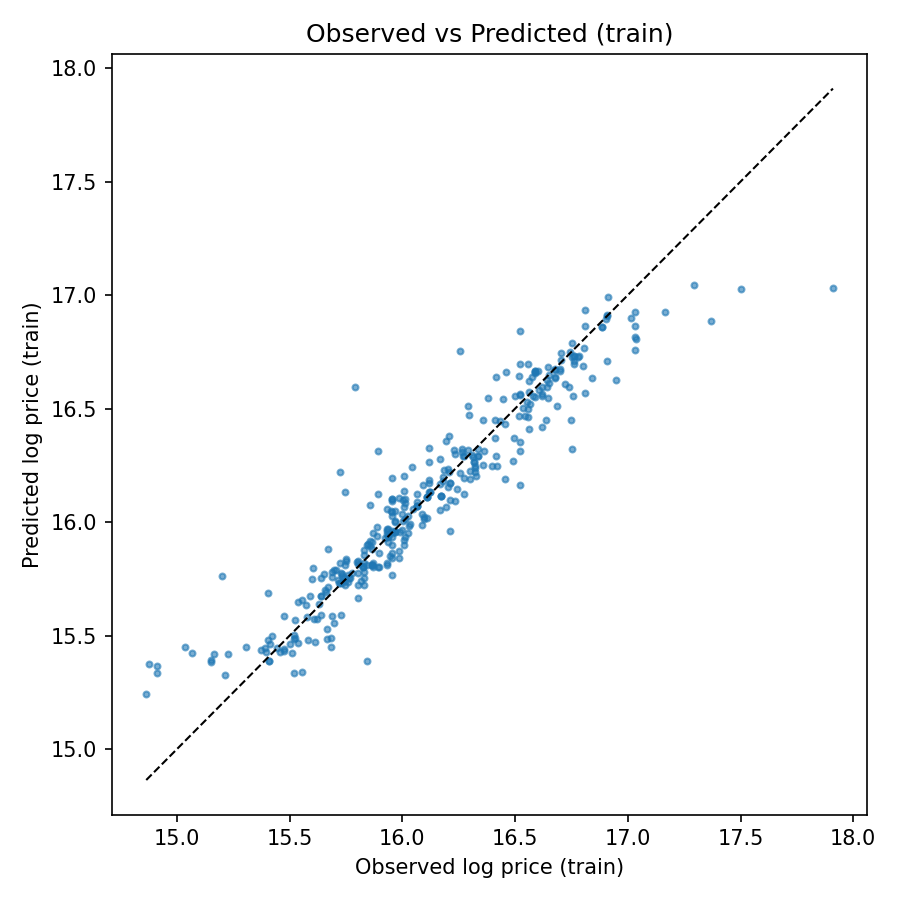
For each run I keep a saved model and a few artifacts for review: a short metrics summary, a table of feature importances and the predictions on a held-out test set. The three figures below are my primary diagnostics, they make it clear whether the model is learning meaningful structure and where to focus next.
Diagnostics
Current performance (approx.)
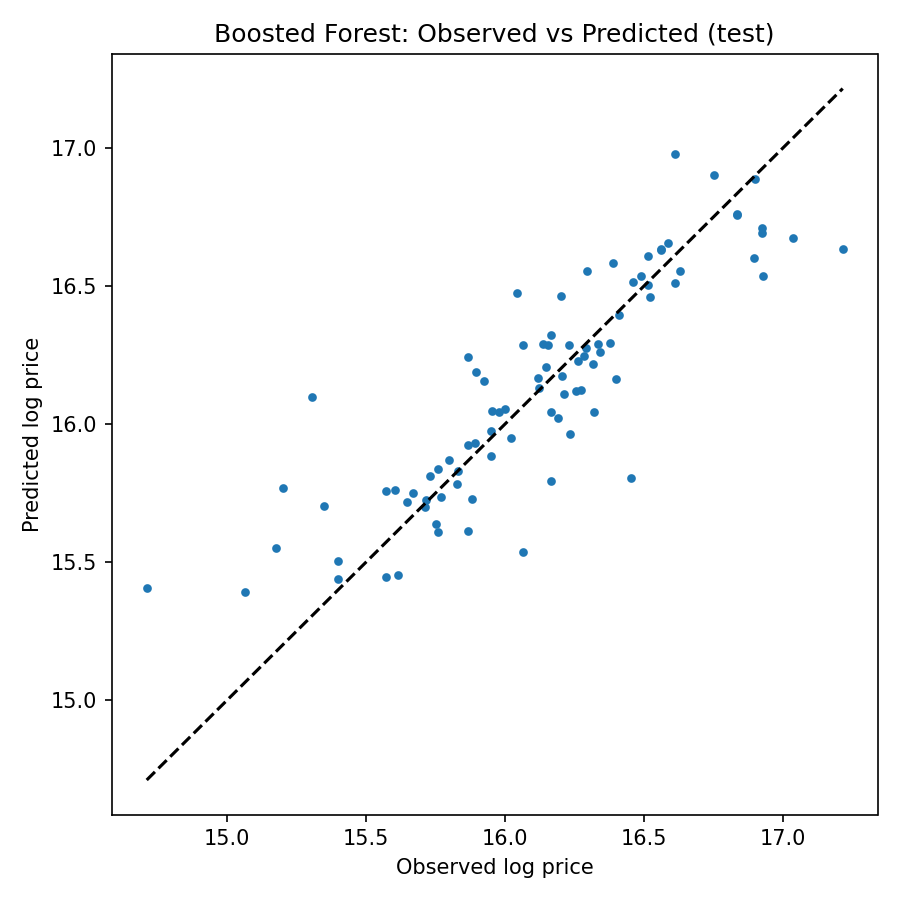
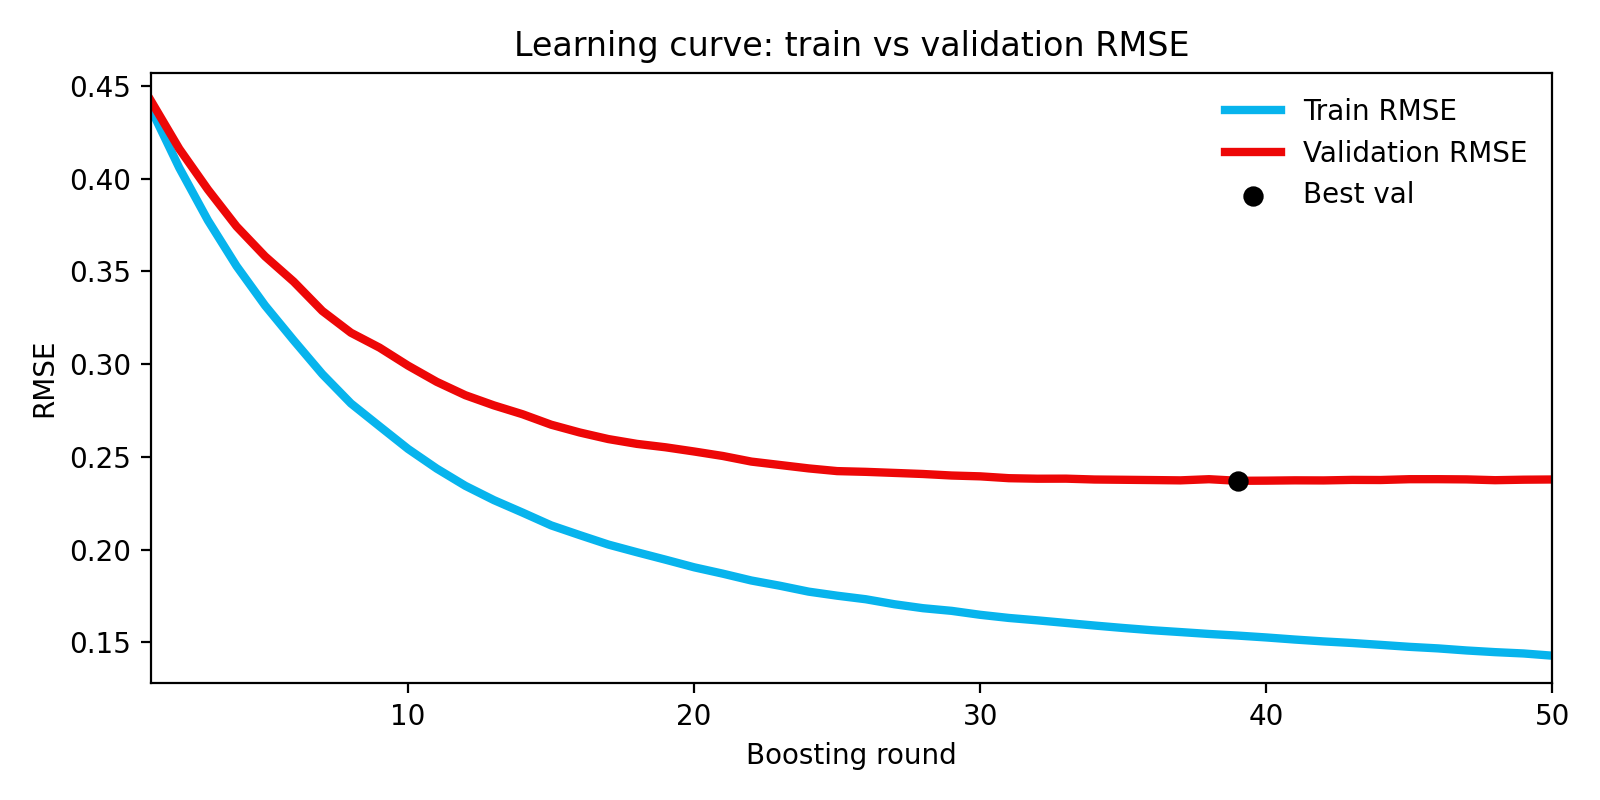
On a held-out test split the model shows a validation RMSE around 0.24 (log-price) and an MAE on the same order of magnitude (~0.18 in log-price). In multiplicative terms this corresponds to typical errors of roughly 20–30% on price, a useful baseline given the model's simplicity. Exact numbers for the run are saved with the artifacts (see the `metrics.txt` in the run `save_dir`).
Interpretation & next steps
The boosted forest is an effective baseline: it explains most of the predictable variation and is fast to run. Practically speaking, it excels on standard, well-measured listings and underperforms on edge cases, very small or very large properties, and listings with missing or noisy area values.
- Add a few targeted features (building-level aggregates, improved transport covariates).
- Train quantile estimators to produce uncertainty bands rather than only point estimates.
- Where residual clusters persist, investigate local premiums or data quality issues.